You Caught Me Backlogging!

It should come as no surprise that I'm a firm believer in backlogs.
Creating, curating and executing a list of work is a fantastic way to accomplish just about anything, whether it be a day-to-day job, a personal learning goal, writing regular content for a blog, or delivering a software engineering project.
Or maybe even managing all of the projects across an entire department in Atlassian.
See, Now You Respect Me
Let's go back to basics for a moment and define the term backlog.
A backlog is just a fancy to-do list, where the elements in the list define work that needs to be completed to achieve something. It doesn't really matter what the something is, what matters is that it is large enough that it can't be completed as a single step.
The items in a backlog are not all well defined. Things that need to be executed soon are clear and easily able to be understood, while things that might need to be executed later are likely to be vague, half-formed ideas that need further investigation or analysis.
The order of the items in the backlog is important, with the most important, most impactful or most foundational work coming first, and the rest of the work being sequenced in some sort of meaningful order after that.
Most importantly, a backlog is living thing and requires consistent attention in order to keep it relevant. By the time you've delivered the first few things, either you will have learned more or reality will have shifted, changing what you need to do next, and the backlog will need to be adjusted as a result.
Pretty simple right?
Because I'm A Threat
The most common use of a backlog is for a single project.
You or your team has something that needs to be done and it's too big to do as a single step, so you break the work down into smaller pieces and start incrementally delivering those pieces, adjusting the scope and ordering as necessary to achieve the goal.
That's just one project though. Most teams deal with multiple projects, especially over time.
Wrangling that higher level problem can also be solved with a backlog.
A project backlog.
Really, it's just doing the same thing at a higher level of abstraction, but putting all of your projects in a backlog enables all sorts of useful activities.
You can groom, adding context, clarifying scope and generally making sure that when the thing needs to be picked up and kicked off by a feature lead, there is enough information in there that they don't need to start from scratch.
You can order, applying some sort of rubric for deciding what is the most important thing to work on next, probably by considering the combination of value delivered and cost of delivery (aka engineering effort).
You can communicate, sharing the work that the team has on its plate with stakeholders, the dependencies between that work (both internal and external) and any risks to delivering it that would impact higher level initiatives.
There are a lot more benefits to having all of a team's projects represented in a backlog, but a more important question is where to put it.
That's The Way It Works
Until relatively recently, my tool of choice for a product backlog was a spreadsheet. Specifically a Google Sheet.
There are a bunch of things that are really good about Google Sheets for this purpose:
- It's incredibly flexible. You can have whatever data structure you want
- It's easy to share. You can paste a link to it to anyone and they can read it
- It's inherently collaborative. People can edit, comment and so on
- It's trivially easy to add new projects. It's literally just a row in a spreadsheet
Of course, it has a bunch of limitations too, but moving to something heavier, like a full-fledged Jira project or Trello or something, just wasn't worth the effort.
And then someone introduced me to Jira Product Discovery (JPD).
JPD is basically a fancy spreadsheet, except every row in the spreadsheet is technically a Jira ticket, giving access to all of the persistent goodness that that sort of thing allows. Strictly speaking, calling it a fancy spreadsheet is probably doing it a disservice, but that's all I really wanted, so that's how I think about it.
It has all of the features that I enjoyed about my spreadsheet solution, plus I can accumulate context easily, link things together and create views for presentation and analysis at will.
If you're doing any sort of project backlog management, I seriously can't recommend it enough.
You'll probably need to spend some time customising it though.
Oh Ho Ho, You Sly Dog
The default configuration that you get out of the box when you create a new JPD project isn't terrible, but it didn't really work for me.
As a result, I landed on something like the image below.
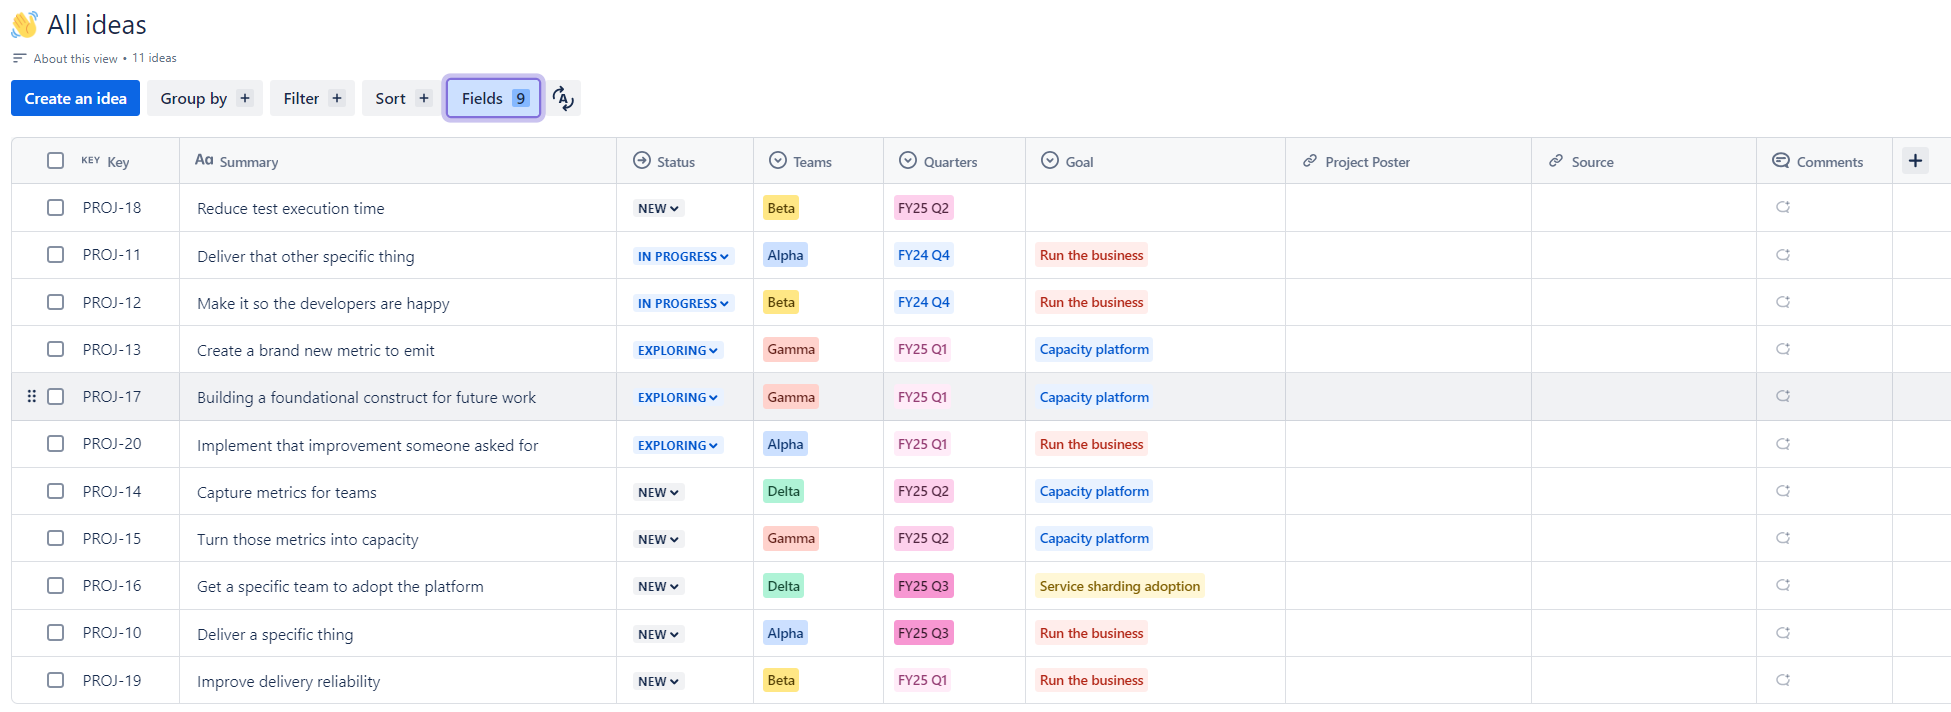
Obviously, I can't share our actual project backlog on the internet, but that picture is a close approximation and clearly shows the most important fields that we are making use of.
- Key and Summary are no-brainers. That's just your standard Jira ticket identifiers. They come built-in
- Status is also a no-brainer, though we diverge from the default and instead use
New,Triaged,Exploring,In Progress,DoneandAbandoned. For context,Triagedmeans that we have at least looked at the project as a group and have a basic handle on it andExploringmeans that we are actively investigating the project (i.e. creating technical proposals or something similar). The rest are self-explanatory - Teams is straightforward. It's the team that is either doing the work, or who will probably do the work at some point in the future. The project backlog organises the work for four internal teams and a few external ones as well, so this differentiator is important. Note that this is a multi-select, though we try not to have more than one team responsible for a single project (instead preferring multiple projects)
- Quarters is also pretty simple. It's either the quarters in which the project was actively worked on OR it's the quarter that we think we might do the work. The second use case is useful for creating roadmaps and other visualisations of when work might happen
- Goal is the overarching goal or theme that the project contributes to. We typically use this to tie together work into initiatives. In the mock-up above, the
Capacity platformgoal is an example of that, tying together multiple projects across multiple teams. Because it's a field, you can create a view on it, creating Goal specific roadmaps and visualisations - Project Poster is just a way to encourage people to centralise the documentation for a project, which for us usually means a Confluence page. The poster contains more detailed information than the ticket and usually comes when the project is being explored
- Source is a link to some canonical representation of the origin of the work (like a Jira ticket in an official request raising system or something) and is used to differentiate work that other people are asking us to do against work that we're doing for ourselves
We have more fields than the ones I've described above, but this section was already getting a bit long, so I think that's enough for now. With no further explanation, we also have work taxonomy, estimate (rough), estimate (detailed), due date and ATLAS ticket.
Beyond the fields, we also have a bunch of custom views. A concrete example of that is the planning view for next quarter, which just shows all projects tagged with the next quarter, grouped by team.
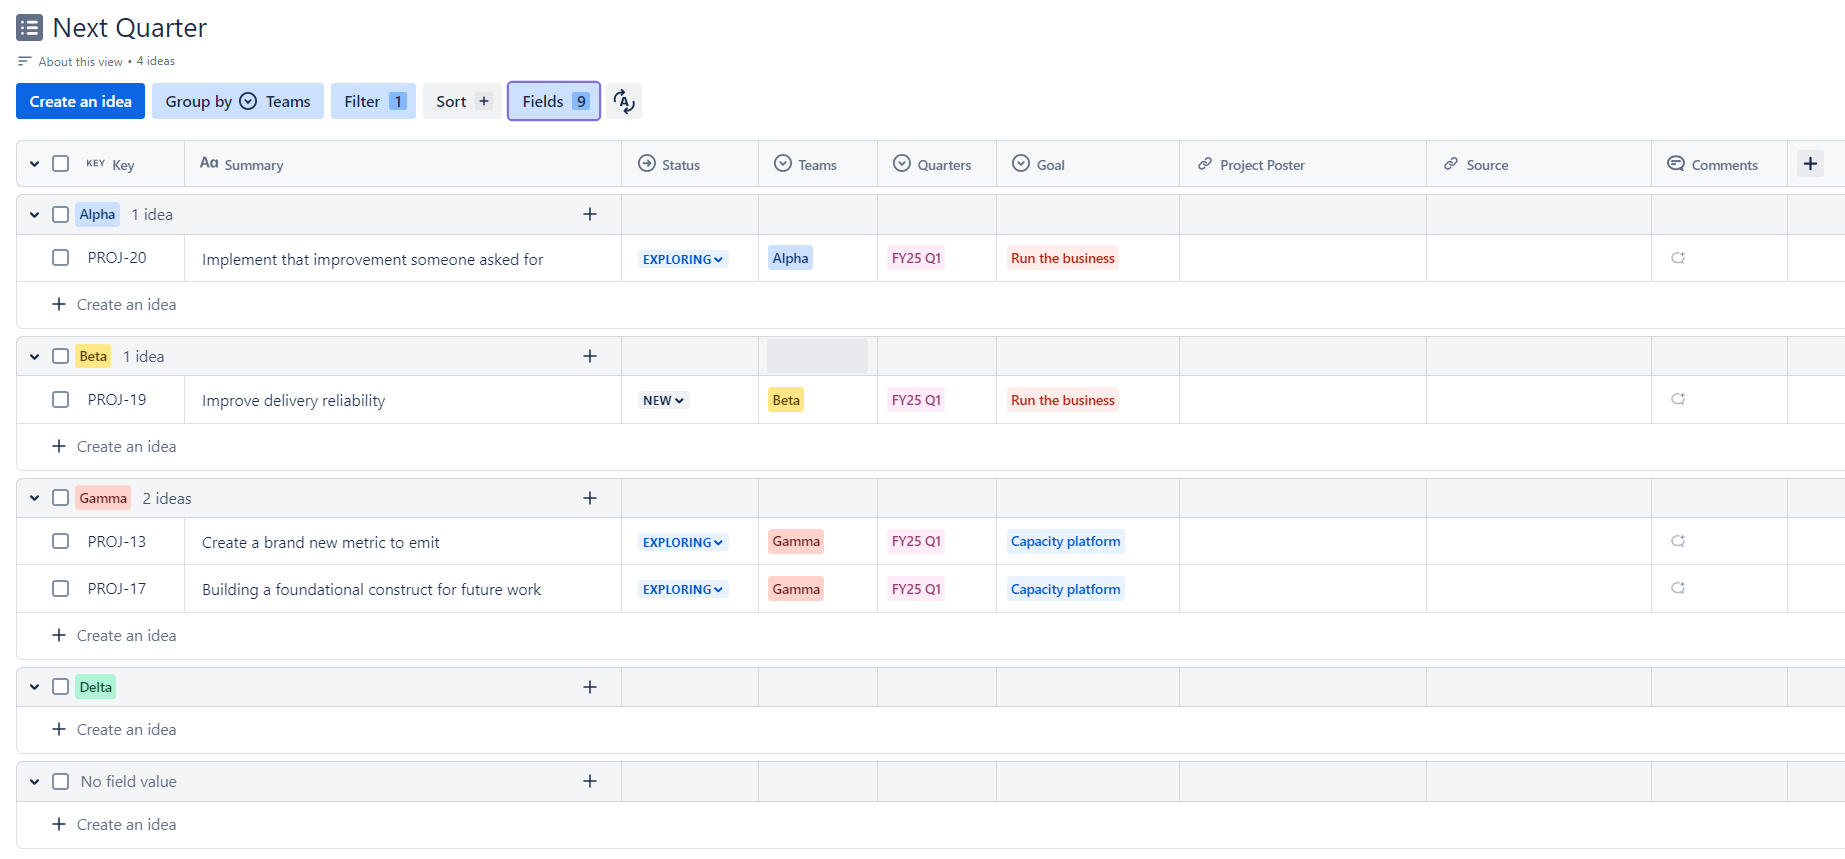
With this view, we can incrementally add and remove things, make decisions about what we might do, order the projects and groom them as necessary, ensuring that we are ready to actually commit to a plan and deliver things when the next quarter rolls around.
Another example of a view is a goal specific roadmap, which is a board where the columns are defined by the quarters field and there is a filter that only shows things that are associated with a specific goal.
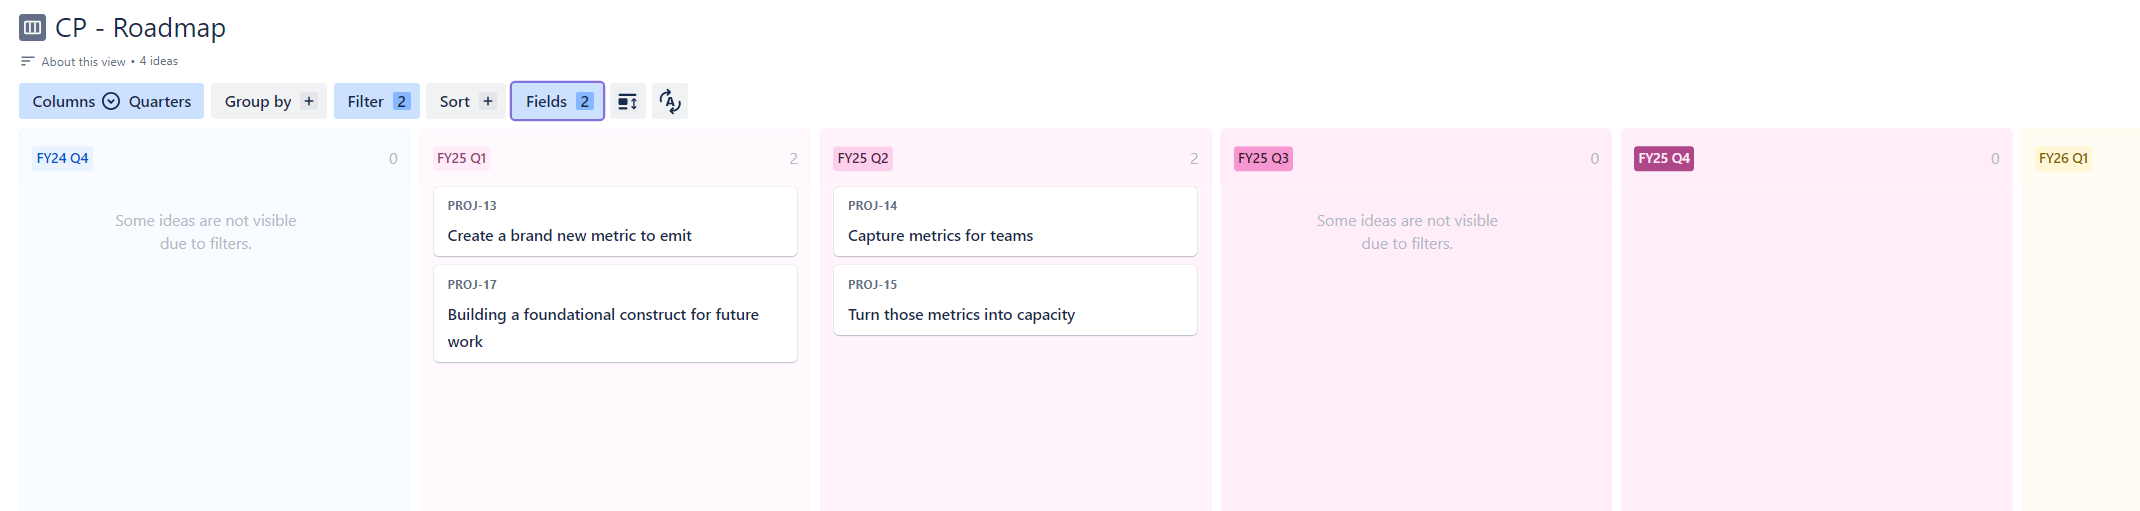
Capacity platform goalThis is useful for long-range planning, especially for large initiatives and programs, and is just kind of pretty to look at. I particularly enjoy how the columns inherit the colours of the fields they are based on, because it makes things more intuitively understandable.
I CAN Believe It
I was pretty attached to my original spreadsheet-based project backlog, but honestly, having moved all of that into Jira Product Discovery, I don't think I could go back.
One word of warning though.
The project backlog and the systems that underpin it must be owned by a single person. Many people can contribute, but the actual configuration should be tightly controlled.
Tools that are flexible and easy for people to customise and change depending on their whims and preferences are great, but that can quickly lead to a monstrously complicated and unwieldy system that no-one really knows how to use properly.
Once you get into that situation the value in having a centralised backlog drops sharply.
Rule your backlog with an iron fist if you must.
Or you'll probably regret it.
Member discussion